Monitoring your Diffusion Cloud usage from the Diffusion Cloud Dashboard
Use the Usage page of the Diffusion™ Cloud Dashboard to monitor how much data you are using and the estimated cost of the month's data.
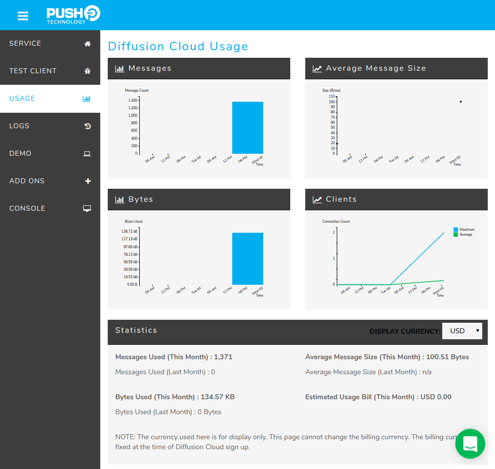
Graphs
The Usage page provides graphs of the following information:
- The number of bytes sent
- The number of messages sent
- The number of concurrent client connections
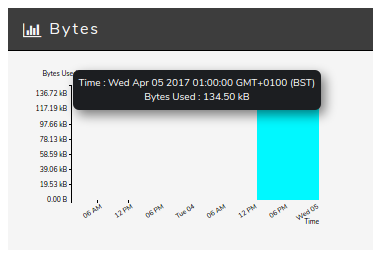
You can hover over a specific point in the history graph to see the information for that time.
Statistics
The Usage page also provides the following statistics for the current
and previous month:
- Messages used
- Bytes used
- Average message size